Carcase Data
2022 Spring Bull Sale
110 "Bulls with a Difference"
Certified Organic King Island Grass Fed Raff Angus Steers
 Raff Angus Feedback Sheets from JBS & Greenham Tasmania Pty Ltd
23rd May 2022 Beef Cow and Jap Ox Heifer feedback sheet
28th March 2022 Beef Cow Feedback Sheet
10th Januray 2022 Beef Cow and Jap Ox Heifer feedback sheet
4th January 2022 Certified Organic Steer feedback sheet
13th December 2021 Jap Ox Heifer feedback sheet
8th November 2021 Beef Cow feedback sheet
28th September 2021 Beef Cow feedback sheet
5th July 2021 Beef Cow and Jap Ox Heifer feedback sheet
15th June 2021 PRIME YEARLING STEER Carcase Feedback ~ full brothers to August 23rd spring sale bulls
20 May 2021 CULL COW Carcase Feedback
1 March 2021 CULL COW Carcase Feedback
20th Dec 2020 PRIME YEARLING STEER Carcase Feedback ~ full brothers to March 26th sale bulls
20th Dec 2020 PRIME YEARLING HEIFER Carcase Feedback ~ full sisters to March 26th sale bulls
7th Sept 2020 PRIME YEARLING STEER Carcase Feedback ~ full brothers to Sept 21st sale bulls
13th July 2020 PRIME YEARLING STEER Carcase Feedback ~ full brothers to Sept 21st sale bulls
* See below for more Feedback Sheets 2018-2020
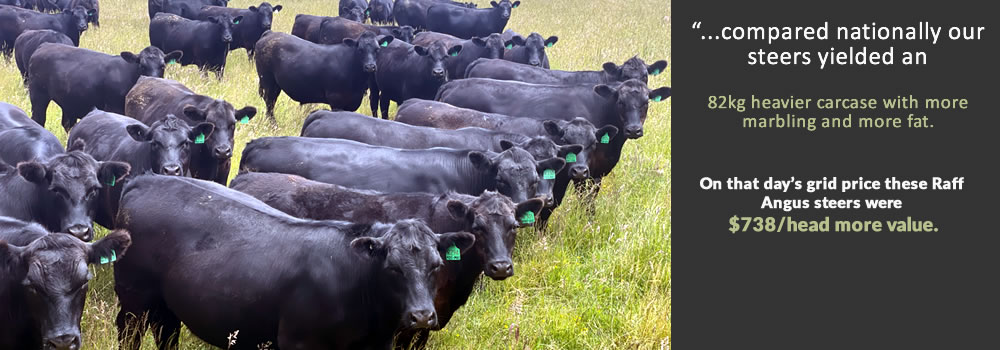
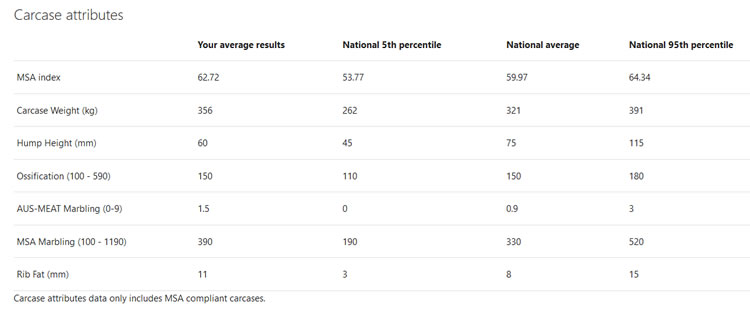
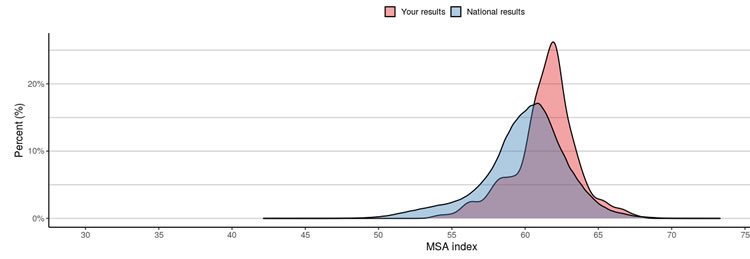
The below graph lists details on the 59 steers that are the spring born contemporary brothers to rising two year old bulls that sell August 23rd – these were the bottom 50% of all spring male calves born that season. It shows the National comparison for all steer animals processed that day. With the same ossification score, no HGP & 100% grass fed sorting selection these Raff Angus genetic brothers to sale bulls produced a 35kg heavier carcase weight with more fat and more marbling. With the grid price of $7.40 at that time this equated to a $259 per head increased dollar value.
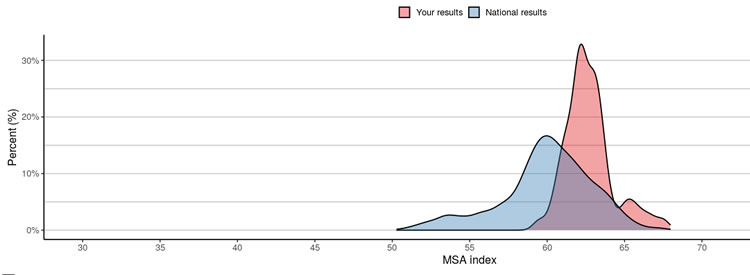
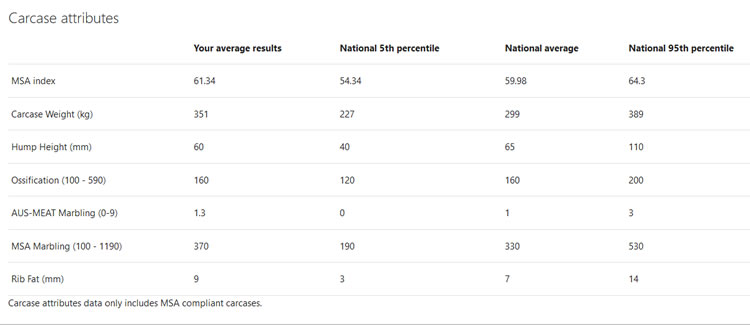
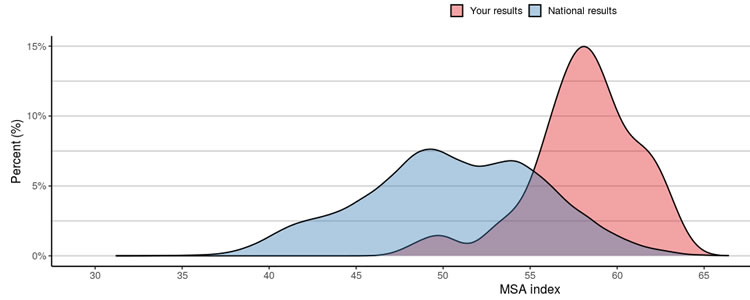
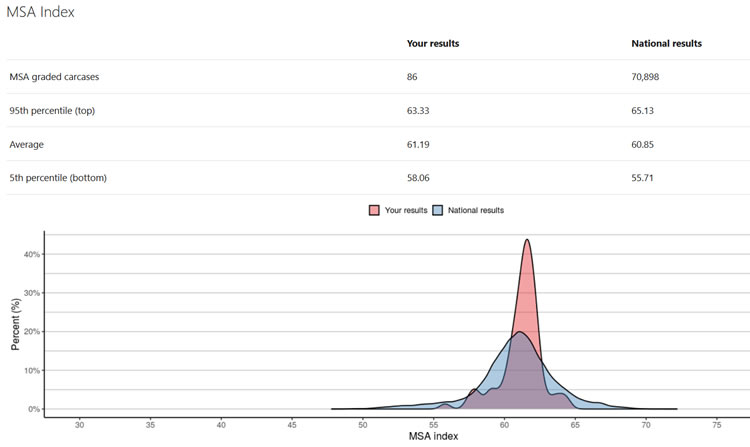
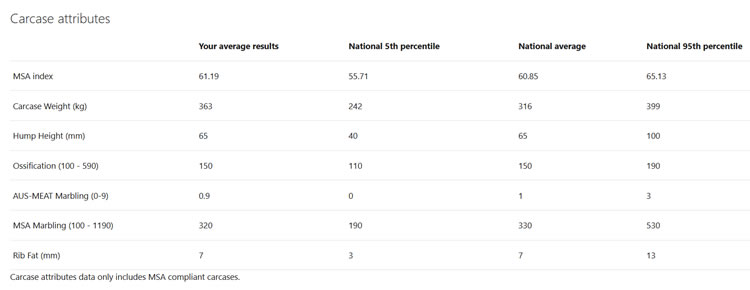
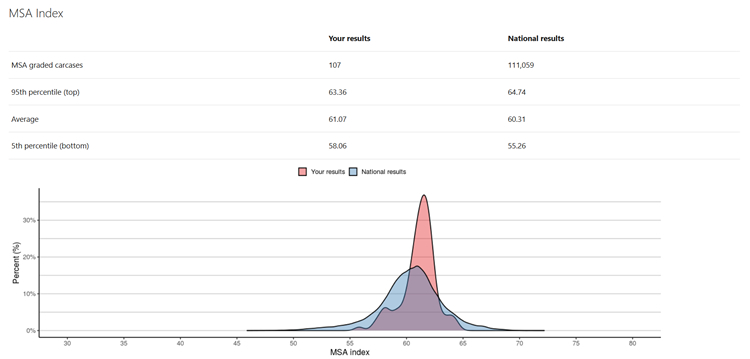
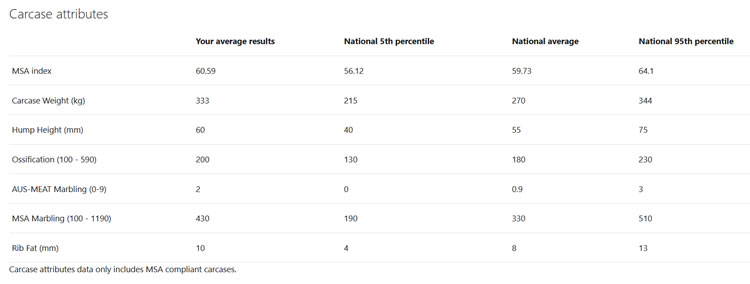
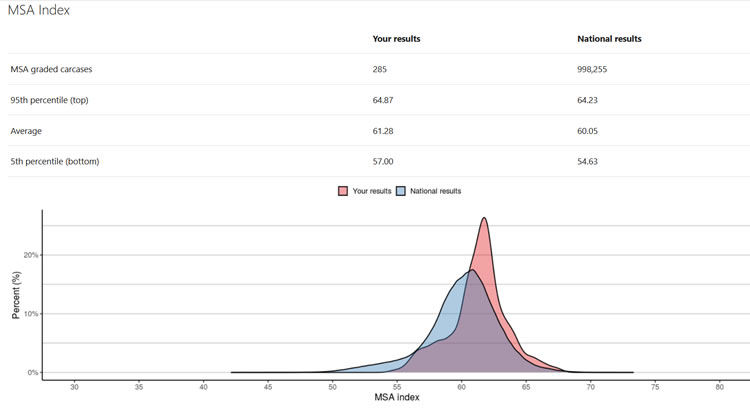
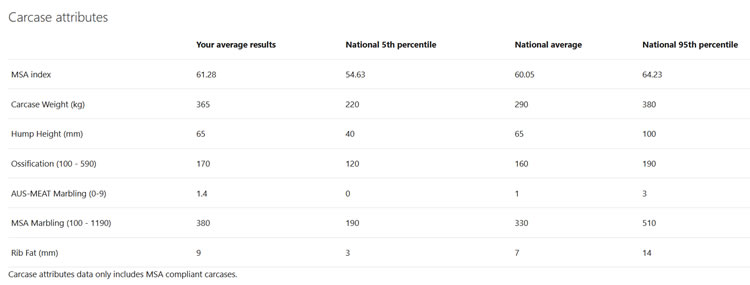
The below graph compares our 260 breed society registered and performance recorded steers and heifers processed during the past 12 month period (June 2020 – June 2021) against the 1,041,003 steers and heifers processed Nationally during same period. With the same ossification score for all animals processed that 12 month period - sorted as grass fed only with no HGP - these Raff Angus mixed sex carcasses had a 52 kg heavier carcase weight, a higher MSA Index (averaged 61.34), more marbling and more Fat. Using an average grid price of $6.90/kg carcase weight for the period this equates to a $358/head increased value.
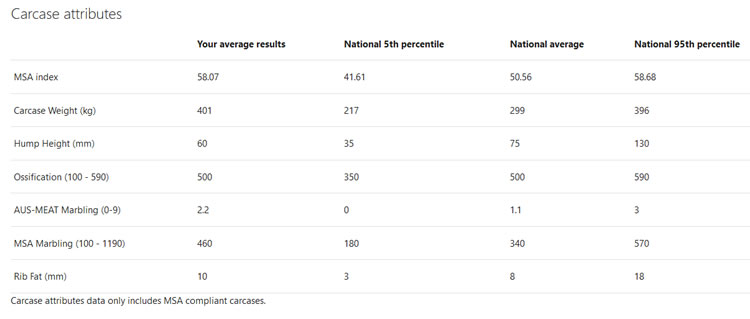
The below graph shows where the 77 Raff cull cows compare Nationally from a carcase standpoint. It shows the National comparison for females only with an ossification score >300, no HGP & 100% grass fed sorting selection. Comparing against the 96,286 cows processed over past 12 month period these Raff Angus stud cows (with the same ossification score average) produced a 102kg heavier carcase weight with more fat, a AUS-MEAT Marbling score average of 2.2 (compared to national average of 1.1) and a MSA Index average of 58.07. With the grid price of say $5.50 average this equated to a $561 per head increased dollar value or, for a two deck trailer load of 36 cows, an increased earning capacity of over $20,000.
These below MSA Index graphs show where Raff Angus sits nationally with its genetics on animals processed throughout the 2020 year. Please take the time to scroll through these to better understand the genetics of Raff Angus from a carcase standpoint not from a scientific assumption on paper calculated from a herd with little linkage to mainstream Australian Angus genetics.
The below graph lists details on the 89 steers that are autumn born contemporary brothers to bulls that sell March 26th. It shows the National comparison for all steer animals processed for month of December 2020. With the same ossification score these Raff Angus genetic brothers to sale bulls produced a 47kg heavier carcase weight. With the grid price of $6.70 at that time this equated to a $315 per head increased dollar value or nearly a $12,000 increase per trailer load.
These 111 steers and heifers are contemporary brothers and sisters to bulls that sell March 26th. The below graph details the Raff Angus combined steer and heifer autumn born National comparison for all animals processed for the month of December 2020. With the same ossification score for all animals processed that month these Raff Angus animals had a –
- 59kg heavier carcase weight
- Higher MSA Index
- More marbling
- More Fat
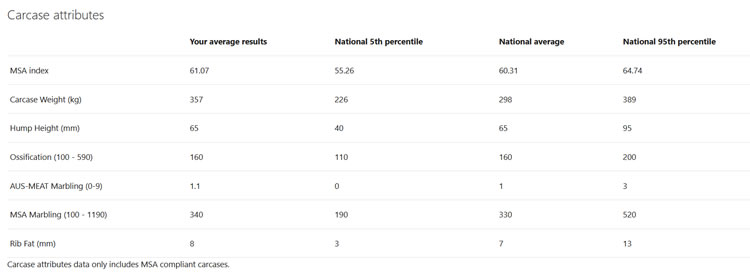
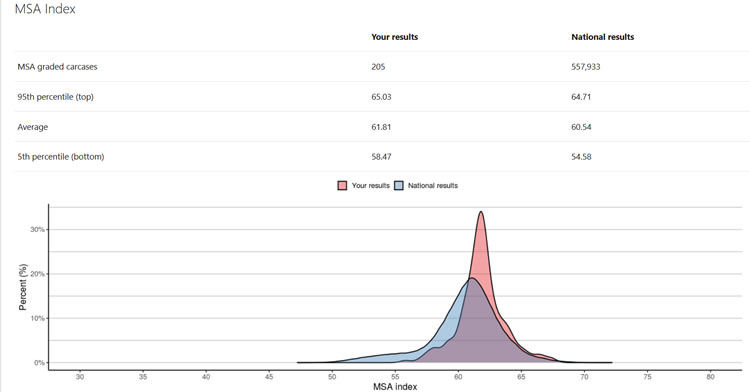
The below details the National comparison for the 213 Raff Angus Steer Carcases processed against the near 558,000 bodies during the 2020 year.With only a 10-point ossification variance these 213 Raff Angus 100% pasture raised, no HGP & no antibiotic steers boasted a 65kg heavier carcase with a higher MSA Index, more marbling and more fat.
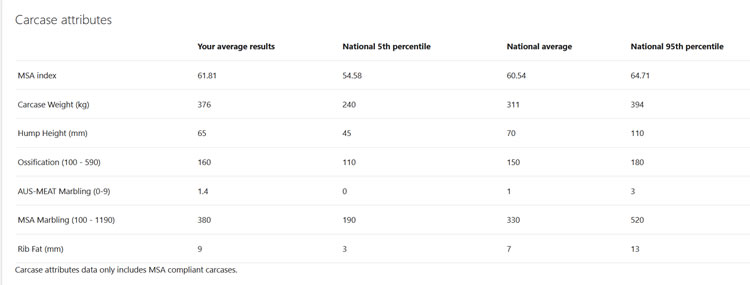
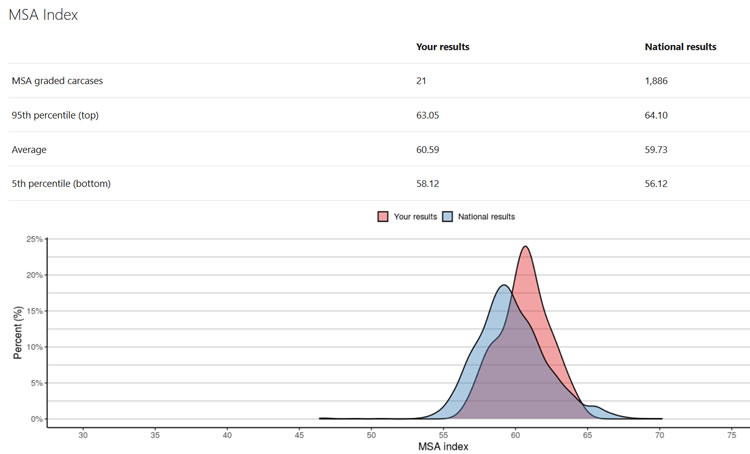
These 22 heifers are autumn born genetic sisters to bulls that sell March 26th. The below is a National comparison for all heifer animals processed for month of December 2020. Being mindful of the 20-point ossification variance these Raff Angus heifers still prove that Raff Angus genetics produce heavier carcase weights with more fat and more marbling when compared nationally.
The below graph details the National comparison for the combined 298 Raff Angus Steer and Heifer carcases processed over the year of 2020. Despite the majority reported on paper as some of the less profitable Angus within the TransTasman Angus Cattle Evaluation this graph proves that Raff Angus genetics are profitable.
- Heavier carcase weights
- Higher MSA Indexes
- More marbling
- More Fat
Raff Angus – do their EBV’s reflect them fairly?
It is well documented that for decades we have struggled with the way Breedplan has reported our herd.
In the late 1990’s we had a bull client and major Queensland pastoralist phone us just days prior to our annual on-property bull sale. He said that he was delighted with the bulls he had purchased over past years – they handled the harsh western environment, they produced plenty of calves born easily which later performed, sold and bred well. However, he was having trouble justifying his purchases at a board level because our EBV graphs were not good enough – despite their actual performance. He withdrew from purchasing Raff Angus genetics.
Several years later, still confused with the reporting of our herd, we engaged a well-regarded consultant to spend the day on farm with us to advise. We showed him every animal that walked returning to the house for a coffee and general summary of his opinions later in the afternoon. We opened our Breedplan report and started with the first trait – Calving. At that time and, in truth not much on paper has changed since then, almost all of our cattle were reported as hard calving. We questioned why we are reported as such when in actual reality we statistically assist about 6% of heifers (rarely using ‘true’ heifer bulls) and almost never assist cows excluding abnormal presentations. He asked if we submitted calving data – we did. After several more questions he said quite frankly –
‘Your herd does not have genetic linkage to mainstream. Because the genetics you use are higher growth, higher yielding with bigger carcase weights and are not genetically aligned to mainstream the “system” does not believe you when you tell it you only have slight calving issues. You assist about 6% - the system thinks you should assist about 20%. Because of your refusal to use mainstream genetics for linkage to solve this you will have to falsify and submit that you assist another say 16%. I know, he said, that this will unfairly report these animals but what it will do is then significantly correct and improve the remaining 80%’. The interest in conversation was lost at that point and the meeting was closed. His fee was $1,500.
Growth has always been easy to measure and accurate to report – they either weigh heavy or they don’t.
Carcase EBV mid parent assumption vs Actual Carcases hanging on the hook…
The above graphs are the true indicator of where Raff Angus genetics sit within the Australian Beef Industry.
Over the past 5 years since our business re-structure we have had hundreds of pedigree recorded animals processed. Within groups we have seen:
- the lowest IMF EBV animal record the highest Marbling score
- the Less Profitable graphed Index EBV animal return the highest $$ carcase value
- the highest IMF EBV animal record the lowest MSA Marbling score
- the leanest fat EBV animal record the highest carcase fat
- high IMF EBV animals constantly have a lighter carcase and lower $$/head value
As a seedstock breeding program of 55 years dedicated to supplying superior genetics of Angus cattle to the Australian Beef Industry it is insulting to have our herd reported as Less Profitable by way of a graph generated by a computer when in reality our actual Carcase Data and clients' success reports quite the opposite.
 Raff Angus Feedback Sheets from JBS & Greenham Tasmania Pty Ltd
1st June 2020 CULL COW Carcase Feedback
9th June 2020 CULL COW Carcase Feedback
22nd June 2020 CULL COW Carcase Feedback
29th June 2020 CULL COW Carcase Feedback
29th June 2020 PRIME YEARLING HEIFER Carcase Feedback
20th April 2020 PRIME YEARLING HEIFER Carcase Feedback
16th March 2020 PRIME YEARLING STEER carcase feedback
31st March 2020 PRIME YEARLING STEER carcase feedback
Feedback Sheet 26 July 2019
Feedback Sheet 17 January 2019
Feedback Sheet 10 January 2019
Feedback Sheet 3 January 2019
Feedback Sheet 13 November 2018
Feedback Sheet 28 August 2018
Feedback Sheet 23 July 2018
Feedback Sheet 24 May 2018
Feedback Sheet 13 April 2018
Feedback Sheet 18 January 2018